← Back to portfolioProject library · 14 case studies

Every project.
One business lens.

Fourteen cases led by customer, product, supplier, and growth intelligence—followed by the operational, financial, forecasting, and data systems that make decisions move.

01Customer intelligence

Omnichannel Customer Intelligence & NPS

A weekly decision system connected in-store and e-commerce NPS, customer comments, product issues, supplier signals, and regional performance—helping teams act on the experience behind the score.

Business question

Customer feedback existed across channels, but leaders needed one view that explained which stores, products, suppliers, and recurring issues were moving the customer experience.

How it moved

Unified weekly, PTD, and YTD NPS with high- and low-performing stores, raw customer comments, AI summaries, product intelligence, supplier intelligence, and regional comparisons in one executive workflow.

Omnichannel NPSVoice of customerProduct & supplier intelligence
01
Business outcome78 → 92

NPS across both in-store and e-commerce experiences

02Service intelligence

Customer Operations Intelligence

A centralized service-intelligence platform moved Freshdesk data into Snowflake and turned customer conversations into executive workforce, issue, and agent-performance reporting.

Business question

Customer issues and agent activity were trapped in the service UI, limiting historical analysis, workforce planning, and visibility into the problems customers were raising most often.

How it moved

Integrated Freshdesk through Fivetran, orchestrated dbt models across a Snowflake medallion architecture, and added AI categorization to surface issue themes, service demand, and agent performance.

FreshdeskWorkforce optimizationAI issue intelligence
02
Business outcome1 source

for service demand, workforce optimization, issues, and agent performance

03Commercial growth

Marketing & Growth Intelligence

A connected measurement system brought sessions, media spend, sales, customer acquisition, retention, and Meta offline conversions into the same commercial view.

Business question

Marketing teams needed to see more than campaign activity—they needed to understand how investment influenced digital behavior, in-store purchases, customer growth, product choice, and retention.

How it moved

Automated week-over-week performance reporting, built a Snowflake-to-Meta offline conversion feed, and connected customer listening, product promotion, cross-selling, pricing, and retention signals to marketing decisions.

Marketing measurementMeta attributionAcquisition & retention
03
Business outcome700K → 770K

customer base in four months, supported by stronger commercial visibility

04Product intelligence

Product, Pricing & Supplier Intelligence

A commercial intelligence layer connected historical pricing, competitive position, product-level customer feedback, repeat behavior, supplier performance, and assortment decisions.

Business question

Product and pricing decisions were being made without a complete historical view of SAP prices or a shared connection between customer feedback, repeat purchase, supplier performance, and store execution.

How it moved

Reverse-engineered pricing history since inception, joined it with product NPS, price and quality flags, supplier signals, repeat-rate behavior, one-time-seller risk, competitive pricing, and planogram stability.

Pricing historyProduct healthSupplier intelligence
04
Business outcomeFull history

of product pricing since inception reconstructed from SAP

05Margin improvement

Operational Cost Optimization

A profitability model exposed products with negative contribution margins and inefficient volume-to-box ratios. Scenario testing helped teams reshape the assortment without sacrificing sales volume.

Business question

Operating cost was visible in aggregate, but the product-level choices creating margin pressure were difficult to isolate and act on.

How it moved

Connected cost-to-serve, assortment, packaging, and sales-volume signals into one decision view, then tested scenarios with commercial and operations partners.

ProfitabilityAssortment strategyCost-to-serve
Operational Cost Optimization artwork using the original portfolio visuals
05
Business outcome$1.75M

annual savings and a 35% reduction in operating cost

06Last-mile growth

Distance Matrix Routing Engine

An AI-driven routing engine that assigns each order to the nearest eligible store. A two-stage geographic filter lowered API cost while improving dispatch accuracy.

Business question

Expanding frozen delivery required reliable store assignment without paying for unnecessary drive-time calculations on every possible route.

How it moved

Used ZIP geometry to reduce the search area first, then applied selective distance-matrix calls only to viable stores before final assignment.

Delivery expansionRoutingCustomer experience
Distance Matrix Routing Engine artwork using the original portfolio visuals
06
Business outcome18%

revenue increase through better delivery coverage and routing

07Executive reporting

Data Visualization & Reporting

An enterprise reporting layer designed for leadership action across operations, logistics, marketing, product performance, finance, and granular P&L visibility.

Business question

Leaders were navigating fragmented reports and inconsistent definitions when they needed one clear view of business performance.

How it moved

Standardized business logic, prioritized decision-ready KPIs, and designed a connected reporting experience for executive and operating teams.

C-suite reportingSelf-service BIOne decision layer
Data Visualization & Reporting artwork using the original portfolio visuals
07
Business outcome25+

decision dashboards built and maintained for senior leadership

08Forecasting

LSTM Forecasting System

A store-specific forecasting system for weekly gel-pack demand across 18+ locations, incorporating seasonality, holidays, delivery cadence, and manual business adjustments.

Business question

Over-ordering created cost and storage pressure, while under-ordering put frozen fulfillment at risk across stores with different demand patterns.

How it moved

Combined historical demand with operating context and store-level overrides so the forecast could work in real planning conversations.

Inventory controlDemand planning18+ stores
08
Business outcome$150K

annual savings with forecast error consistently below 5%

09Financial visibility

P&L Automation

An automated model unified sales, costs, media spend, freight, returns, and operational inputs from 12 source tables for U.S. and Canada teams.

Business question

Commercial and finance teams needed faster, more consistent profitability visibility across two markets and many source systems.

How it moved

Unified the inputs behind P&L performance, aligned definitions with stakeholders, and delivered self-service views for repeatable analysis.

Financial controlAutomationDecision velocity
P&L Automation artwork using the original portfolio visuals
09
Business outcome2 markets

one self-service source of truth across U.S. and Canada

10Commercial growth

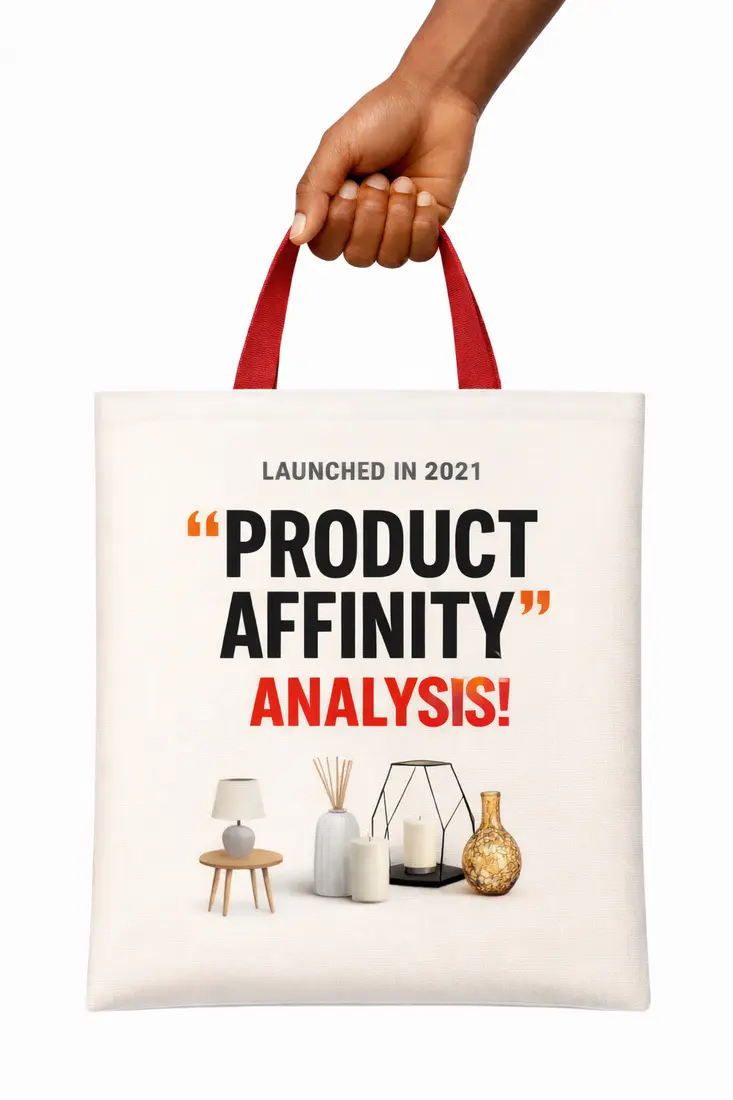
Product Affinity Analysis

Association analysis across roughly 2,000 SKUs surfaced valuable co-purchase patterns for cross-selling, product visibility, placement, and inventory decisions.

Business question

The business had rich transaction data but no practical way to translate purchase relationships into merchandising action.

How it moved

Mapped high-value product relationships and turned them into recommendations teams could use in placement, offers, and assortment decisions.

Cross-sellMerchandising2,000 SKUs
Product Affinity Analysis artwork using the original portfolio visuals
10
Business outcome12%

conversion improvement from more relevant recommendations

11Customer strategy

Customer Segmentation Model

A clustering model organized customers across geographic, demographic, behavioral, and loyalty dimensions into a practical commercial framework.

Business question

Broad customer messaging limited relevance and made it harder to differentiate pricing, loyalty, and promotional treatment.

How it moved

Built interpretable segments, profiled their commercial value, and translated them into targeting and loyalty actions with clear owners.

TargetingPricingLoyalty
Customer Segmentation Model artwork using the original portfolio visuals
11
Business outcome10%

sales growth from better-targeted commercial actions

12Financial recovery

Carrier Invoice Data Audit

A forensic audit across weekly carrier files exposed unjustified surcharges and billing inconsistencies while informing ZIP strategy and contract discussions.

Business question

Millions of invoice rows made recurring overcharges difficult to detect, validate, recover, and prevent.

How it moved

Created repeatable controls around surcharge patterns, shipment attributes, geography, and service performance, then packaged evidence for recovery conversations.

Cost recoveryCarrier strategyOTD improvement
Carrier Invoice Data Audit artwork using the original portfolio visuals
12
Business outcome$300K

recovered, plus up to $250K in recurring annual savings

13Data foundation

Enterprise Data Warehouse Automation

End-to-end pipelines transformed multiple raw business streams into governed models for daily, bi-weekly, and ad-hoc leadership reporting.

Business question

Core reporting depended on fragmented feeds and repeated manual work, weakening trust and slowing executive response.

How it moved

Established reusable data products, quality checks, and delivery rhythms around the business questions that leadership needed answered most often.

Reliable reportingData qualityLeadership visibility
Enterprise Data Warehouse Automation artwork using the original portfolio visuals
13
Business outcomeDaily

decision-ready reporting across core business functions

14Cloud modernization

Cloud ETL / ELT Migration

A cloud migration workflow moved legacy data through structured transformation and modeling into a scalable reporting foundation for business users.

Business question

Legacy flows limited data availability, scalability, and the speed at which teams could answer new business questions.

How it moved

Mapped dependencies, rebuilt the transformation path in the cloud, and kept reporting continuity at the center of the migration plan.

Faster accessScalable dataBusiness reporting
Cloud ETL / ELT Migration artwork using the original portfolio visuals
14
Business outcomeCloud

a scalable analytics foundation replacing fragmented legacy flows